In this blog post, we use an example based on social relationships to introduce the concept of networks. We discuss why mapping relationships as networks is an intuitive and natural way to visualize linked data of any kind, and we provide two examples of applications in banking.
What is a network?
A rudimentary way to think of a network (or graph) is as a set of entities and relationships. These entities could be literally any piece of data, such as natural persons, legal entities, bank accounts, phone numbers, or addresses. Similarly, relationships could be anything that might be used to link different entities together.
The simplest case is to think of two people – let us call them Alice and Bob – who know each other. If we draw two dots (called nodes) to represent Alice and Bob, and a line (called a link) to connect them, then we have a network visualization of the relationship between these two people.

Of course, this relationship can be stored as one row in a relational database, which is easy to maintain and easy to query. If this is the case, why do we need networks at all?
The benefits of graph visualization: make sense of your data
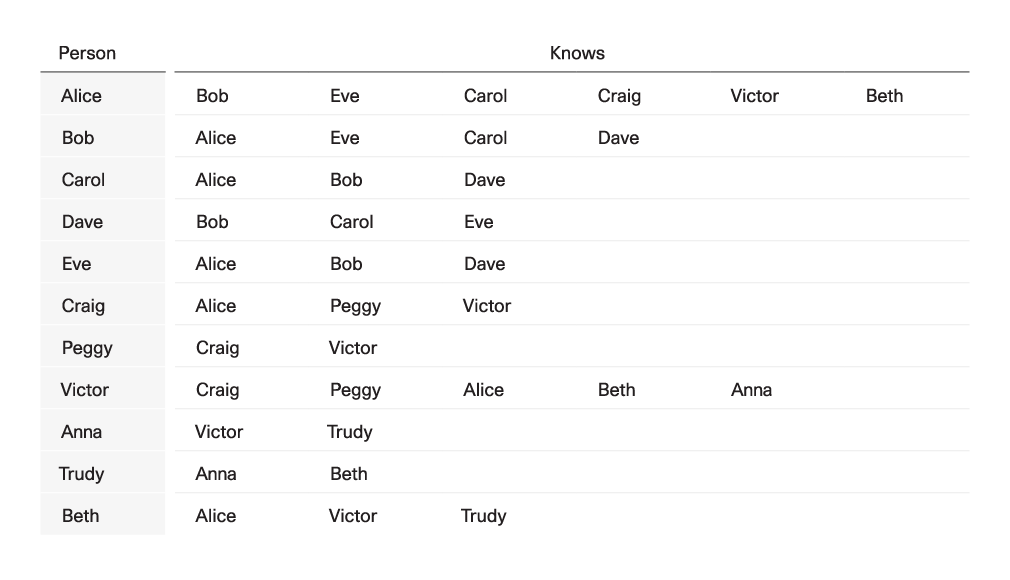
To illustrate the benefits of graph visualization, we will scale up the previous example of people knowing each other. For this purpose, let us consider the following table showing who knows whom within a group of people.

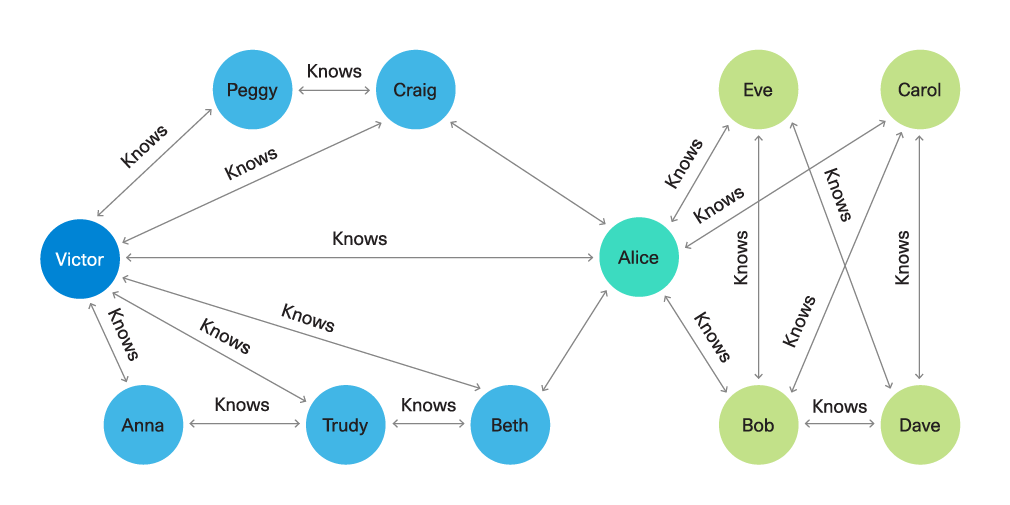
From the above table, we already see that not all people know each other. The two people who know most of the rest are Alice and Victor – this could be easy to verify by a simple count query in a relational database.
What is not visible from the table is that these people belong to two separate groups (communities), and the only connection between these two groups is Alice. However, when looking at the network plot, the pronounced role of Alice is immediately clear. For various applications, this could be very valuable information – for example, when designing marketing campaigns.

Graph analysis focuses on relationships. It helps discover hidden patterns involving different entities and provides exhaustive overviews of how everything is connected. These connections, when visualized as a graph, can provide valuable insights without resorting to the use of elaborate algorithms.
Visual network analysis makes complex types of information easily accessible and interpretable, rendering it a valuable tool for the non-technical user. A well-known example where the use of networks provided valuable insights was the analysis performed by the International Consortium of Investigative Journalists (ICIJ) on the Paradise Papers and the Panama Papers.
These datasets contained millions of leaked documents linking more than 785,000 offshore entities to people and companies in more than 200 countries and territories. They were processed and visualized as networks, which proved to be the best way to explore the relationships and discover hidden connections between the people and entities involved (source: ICIJ Offshore Leaks).
Using graph databases
Avaloq uses a powerful enterprise-wide object model (EWOM) to store any type of information in a consistent way in highly optimized databases. However, retrieving the required relationships to construct a network, even when using the most optimized relational databases, is a computationally expensive process that requires many “join” operations. As a result, the performance of the system will be poor, inevitably leading to increased demands in terms of infrastructure.
In addition, if the number of connections across different data is high and it is necessary to insert new connections or new datasets over time, the system becomes hard to manage. Such problems are easily addressed using graph databases, which are designed to store information directly as graphs. This allows the implementation of flexible data models and minimizes the time needed to query nodes and relationships – even for very large networks.
Applications in banking
Helping compliance officers fight money laundering and financial crime
Data science applies machine learning techniques in anti-money laundering (AML) systems that bring automation to the fight against financial crime. Most of the patterns that are indicative of money laundering leave a trail of transaction sequences. However, spotting these patterns and identifying central accounts and individuals within the bulk of transactions that are registered daily is like searching for a needle in a haystack.
Network analytics provide powerful and efficient algorithms to tackle this problem. For example, testing whether two nodes are connected via a path of any size or finding bridges that link otherwise disconnected parts of the network can be done by using a depth-first search algorithm.
Similarly, when it comes to node centrality, there are algorithms that go beyond a simple count of how many links are connected to a given node. Centrality measures, such as k-core and PageRank, consider how nodes are embedded in a network and rank them not only based on their number of links, but also based on the number of links of their neighbours.
Furthermore, tracking and visualizing the full trail of transactions allows the compliance officer to easily reconstruct suspicious paths, simplifying forensics and auditing activities.
Helping relationship managers identify prospects
Identifying new prospects and approaching them successfully is instrumental for generating new business opportunities. By aggregating internal customer relationship management (CRM) data with structured and unstructured information from external sources, a relationship manager (RM) can query reference information about a client or prospect and get an overview of the individual’s social or business network.
Using this network analysis, an RM can easily perform visual exploration of all known connections between individuals. They can even transverse the entire client book of a bank via connections that would be impossible to find, or even guess, by querying a relational database. This enables the RM to engage in more meaningful conversations with existing clients.
More interestingly, by enriching a network view with public data from the web, the RM will also be able to gain useful insights on potential new prospects. They can personalize their sales pitch and increase the chances of converting prospects into profitable clients.
At Avaloq, we combine the strengths of our powerful EWOM with that of our established partnerships with leading data providers to efficiently link prospects to clients. This data is used by an innovative prospecting tool that we have built to deliver the power of networked data to non-data-expert wealth managers and RMs. The tool, designed by an industry-leading team of data science and network analytics experts at Avaloq, maximizes the potential of one of the most crucial and elaborate tasks of relationship management – gaining new business.


